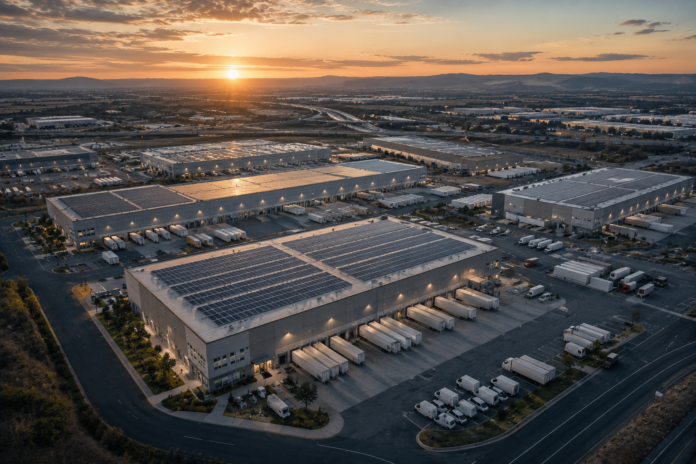
Every online order that skips a retail shelf has to land somewhere first — and that somewhere is reshaping the commercial real estate map faster than almost any other property type.
Quick Answer
Industrial real estate demand right now is being driven by four forces acting together: e-commerce fulfillment, which requires roughly three times more warehouse space per dollar of sales than traditional retail distribution; a manufacturing and sourcing shift toward Mexico and the U.S. Sun Belt as companies de-risk from China-heavy supply chains; a construction pipeline that has fallen more than two-thirds from its 2022 peak; and a slow rebuild of inventory buffers after the lean-inventory years of the early 2020s. Together these forces pushed national vacancy from a record low near 3.5% in 2022 up to roughly 6.8% by early 2025, and the shrinking supply pipeline is expected to pull most primary markets back toward 5.5% to 6% vacancy by the end of 2026.
Why This Cycle Looks Different From the Last One
Industrial real estate has always moved in step with the broader economy, but the 2020–2026 stretch has been unusually lumpy. Warehouse demand spiked violently during the pandemic as households shifted spending from services to goods and retailers scrambled to keep shelves stocked. Developers responded the way developers always do — by building as much as financing would allow. Construction starts nationally peaked at more than 700 million square feet in 2022, a figure that dwarfed anything seen in the prior two decades.
Then demand normalized while that supply was still coming out of the ground. Interest rates rose, e-commerce growth cooled from its pandemic sprint back toward a steadier long-run trend, and big-box retailers that had over-ordered inventory in 2021 spent much of 2022 and 2023 working through backlogs instead of leasing new space. The result was a vacancy spike that alarmed a lot of investors who had grown used to sub-4% industrial vacancy being the norm.
What gets lost in that headline vacancy number is the supply side of the equation. Developers pulled back hard once construction lending tightened and land and materials costs stayed elevated. National under-construction volume fell from that 2022 peak to well under 300 million square feet by 2025 — a contraction few other property types have matched. A market correcting on both demand and supply at once behaves differently than one correcting on demand alone, and that distinction matters enormously for anyone trying to underwrite a warehouse deal, a REIT position, or a logistics-heavy stock for the next several years.
The E-Commerce Cube: Converting Online Sales Into Square Footage
The single most quoted rule of thumb in industrial brokerage circles is that each incremental $1 billion in e-commerce sales generates demand for roughly 1.2 million square feet of distribution space. Compare that to brick-and-mortar retail, where the same $1 billion in sales might require somewhere closer to 400,000 to 500,000 square feet spread across stores, regional distribution centers, and backroom stock. The multiplier exists because online fulfillment carries structural costs that a physical storefront does not.
A store shelf displays one unit of a product and restocks from a backroom or a nearby distribution center. An e-commerce fulfillment center has to hold enough inventory of every SKU to promise next-day or two-day delivery across a wide geography, which means duplicating inventory across multiple regional nodes instead of concentrating it in one place. Pick, pack, and ship operations also need far more floor space per unit moved than a pallet-in, pallet-out wholesale distribution model, because individual-item picking aisles, packing stations, and parcel sortation equipment all consume square footage that a bulk-storage warehouse never needed.
Returns processing adds another layer entirely. Apparel and footwear retailers routinely see return rates above 20% for online orders, versus low single digits for in-store purchases, and every returned item needs inspection, restocking, or liquidation space before it re-enters sellable inventory. A growing share of new industrial leases in the 200,000 to 500,000 square foot range are explicitly built around reverse-logistics operations rather than pure outbound shipping.
None of this means e-commerce penetration needs to keep accelerating for demand to stay firm. Online sales have settled at roughly 16% of total U.S. retail sales, up from about 11% before the pandemic, and even modest continued gains against that larger base translate into steady square footage absorption. The math simply works in industrial real estate’s favor as long as the online share of retail keeps drifting upward, even gradually.
Reshoring, Tariffs, and the China-Plus-One Rewire
Trade policy has become as important a demand driver for industrial space as consumer spending. Tariff escalation on Chinese-origin goods, sustained across two administrations, pushed manufacturers and importers to diversify sourcing rather than absorb duty costs indefinitely. The resulting “China-plus-one” strategy — keeping some production in China while building parallel capacity elsewhere — has funneled enormous capital into Mexican industrial parks, particularly around Monterrey, Saltillo, and Tijuana, and into U.S. border and gateway markets that handle the resulting freight flows.
Laredo, Texas overtook Los Angeles as the nation’s busiest inland port by trade value years ago, and industrial vacancy along that corridor has stayed persistently tighter than the national average because cross-border trucking, customs brokerage, and transload facilities all cluster near the bridges. El Paso and the broader Rio Grande Valley have seen similar spillover demand as automotive and electronics assembly shifts closer to the U.S. market.
Domestically, the same logic favors Sun Belt manufacturing hubs — Phoenix, Nashville, Charlotte, and the Interstate 85 corridor through the Carolinas — where new semiconductor, battery, and electric-vehicle component plants have pulled in a wave of supplier and logistics tenants that need space near the anchor factory. A single large manufacturing plant announcement routinely triggers demand for several hundred thousand square feet of nearby supplier and warehousing space within eighteen to twenty-four months, well before the anchor plant itself finishes construction.
It would be a mistake to read this as a wholesale abandonment of Asia-based sourcing. Total U.S. imports from China remain enormous in absolute terms, and Southern California’s port-adjacent industrial markets, the Inland Empire chief among them, still carry the largest logistics footprint in the country. What has changed is the marginal dollar of new industrial investment, which increasingly flows toward diversified, nearer-shore locations rather than concentrating entirely in the traditional coastal gateways.
The Supply Pipeline: Why Construction Starts Collapsed and What Comes Next
Supply discipline is doing as much work as demand growth to tighten this market back up. Construction financing costs roughly doubled between 2021 and 2023 as benchmark rates rose, and land and steel costs stayed elevated even after headline inflation cooled. Developers who had been building speculative big-box product on thin projected yields suddenly found those yields no longer cleared their cost of capital, and many simply stopped breaking ground.
The pullback shows up clearly in the data. National industrial construction starts fell from roughly 700 million square feet in 2022 to under 200 million square feet by 2024, one of the sharpest multi-year supply contractions this asset class has ever recorded. Under-construction inventory as a share of total existing stock, a metric brokers watch closely as a leading indicator, dropped from above 5% in most primary markets in 2022 to below 1.5% in many of them by 2025.
That kind of supply air pocket does not fix a vacancy problem overnight, because the buildings that were already under construction in 2022 and 2023 kept delivering into 2024, adding to the glut even as new groundbreakings dried up. But once that delivery wave clears — and most forecasts put the tail end of it somewhere in late 2025 to mid-2026 — the combination of a thin pipeline and steady absorption sets up for a meaningfully tighter market. Landlords in markets that overbuilt the hardest, like the Inland Empire and parts of Dallas-Fort Worth, are already reporting fewer concessions and shorter free-rent periods on new leases signed in 2026 than they offered in 2023 and 2024.
Power, Clear Height, and the New Warehouse Spec
Physical building specifications have shifted enough in the last decade that a lot of older industrial stock is functionally obsolete for modern logistics tenants, even though it shows up in the same square-footage statistics as new construction. Clear height — the unobstructed vertical space inside a warehouse — has become the clearest dividing line. Buildings constructed before the mid-2000s commonly topped out at 24 to 28 feet of clear height. New speculative development standard has moved to 36 to 40 feet, because taller buildings let tenants rack inventory higher and move more cubic volume through the same land footprint, which matters enormously in supply-constrained infill markets where land itself is the scarcest input.
Power capacity has become just as important as height, and for a reason that would have sounded strange a decade ago: industrial buildings are now competing directly with data centers for electrical interconnection capacity in some regions. Automated sortation systems, robotic picking, cold storage, and growing fleets of electric delivery vans all demand far more power per square foot than a conventional dry warehouse ever needed. Utilities in several fast-growing Sun Belt markets have interconnection queues measured in years, not months, and a site’s power availability has become a genuine underwriting variable rather than an assumed given.
Multistory logistics facilities, long dismissed as a Hong Kong or Tokyo phenomenon incompatible with cheap American land, are also starting to appear in the most land-constrained coastal infill markets, where a covered land use for last-mile delivery close to dense population centers can justify the extra construction cost per square foot. A closer look at how institutional capital is approaching these vertical formats appears in this analysis of vertical logistics and urban asset strategy, which lays out why pension funds and large private developers are willing to pay a premium for that format in specific submarkets.
Worked Example: Sizing New Distribution Demand in Dallas-Fort Worth
Numbers make this concrete faster than narrative does. Assume a national retailer is projecting $2.4 billion in incremental e-commerce sales growth over the next three years, and that roughly 18% of its online customer base sits within the primary delivery radius served by its Dallas-Fort Worth distribution network.
| Step 1: Incremental e-commerce sales growth (national, 3-year) | $2.4 billion |
| Step 2: Space intensity (sq ft per $1B in online sales) | 1.2 million sq ft |
| Step 3: Total implied national space demand | 2.88 million sq ft |
| Step 4: Share served by the DFW network (18%) | 518,400 sq ft |
| Step 5: Existing DFW vacant modern big-box stock (36ft+ clear) | 340,000 sq ft |
| Net new construction required to meet this single retailer’s need | ~178,400 sq ft |
That gap is small relative to a single 600,000 square foot speculative building a developer might contemplate breaking ground on, which is exactly the kind of mismatch that shapes real underwriting decisions. A developer sizing a new building on the strength of one retailer’s projected growth alone would be building well beyond what that single tenant needs, so the pro forma has to assume the balance gets absorbed by other tenants competing for the same modern, high-clear-height product — a reasonable bet given how few vacant modern boxes DFW currently carries, but still a bet on aggregate market demand rather than a single anchor lease.
Run the underwriting further and the numbers explain why speculative starts have been so scarce: land and shell construction on a 600,000 square foot Class A box in DFW runs approximately $70 to $80 per square foot all-in, or roughly $45 million, and market asking rent on new product sits around $7.25 per square foot net. At a 95% stabilized occupancy assumption, that pencils to a yield-on-cost near 6.1% before leasing costs and tenant improvements — thin enough that many developers are waiting for rent growth or lower construction costs before committing capital, which is precisely the dynamic keeping the supply pipeline this lean.
How Major Industrial Markets Compare Right Now
Conditions vary enormously by metro, and treating “industrial real estate” as a single national market obscures more than it reveals. The table below compares eight of the most closely tracked industrial markets on the metrics that matter most to demand analysis: current vacancy, one-year asking rent growth, the under-construction pipeline as a share of existing stock, and typical Class A cap rates.
| Market | Vacancy | YoY Rent Growth | Under Construction (% of stock) | Class A Cap Rate |
|---|---|---|---|---|
| Inland Empire, CA | 8.9% | -1.5% | 1.1% | 5.6% |
| Dallas-Fort Worth, TX | 9.4% | 0.8% | 2.0% | 6.3% |
| Chicago, IL | 6.2% | 3.1% | 0.9% | 6.1% |
| Atlanta, GA | 7.8% | 1.4% | 1.6% | 6.2% |
| Phoenix, AZ | 11.6% | -2.3% | 2.4% | 6.5% |
| Savannah, GA | 5.4% | 2.6% | 3.2% | 6.0% |
| Northern New Jersey | 5.9% | 2.9% | 0.7% | 5.5% |
| Central Valley, CA | 7.1% | 0.3% | 1.8% | 6.4% |
National average vacancy for reference: approximately 6.8%. Figures reflect representative market conditions compiled from brokerage MarketBeat-style reporting for early 2026 and are intended to illustrate relative positioning, not precise point-in-time statistics for any single data provider.
Vacancy Rate by Market, Visualized
The chart below plots the same vacancy figures against the national average, marked with a dashed reference line, so it’s easier to see which markets are still working through oversupply and which have already tightened back toward equilibrium.
Dashed red line marks the approximate national average vacancy rate (6.8%). Bar length scaled to a 15% axis maximum.
Common Mistakes When Reading Industrial Demand Signals
Analysts and individual investors alike tend to trip over the same handful of errors when they try to translate headline industrial statistics into an investment view.
- Treating national vacancy as a proxy for every submarket. A 6.8% national figure can mask a 5.4% market and an 11.6% market sitting side by side, and the investment thesis for each is completely different.
- Ignoring the difference between gross and net absorption. Gross absorption counts every lease signed; net absorption subtracts space vacated elsewhere. A market can show strong gross leasing activity while net absorption is flat or negative because older, functionally obsolete buildings are being vacated at the same pace new ones lease up.
- Assuming e-commerce penetration keeps growing at pandemic-era rates. Online retail’s share of total sales grew explosively from 2020 to 2021 and has since settled into a much steadier, single-digit-percentage annual gain. Modeling future demand off the 2020 growth rate badly overstates the space needed.
- Overlooking power and utility constraints as a supply variable. A parcel with plenty of zoned industrial land can still be effectively unusable for a modern automated distribution center if the local utility can’t deliver the power within a workable timeline.
- Conflating older, low-clear-height buildings with modern big-box supply. A market’s total industrial square footage includes decades of older stock that many large logistics tenants simply won’t consider, so headline vacancy overstates the amount of leasable modern space actually available.
- Underweighting tenant concentration risk. Markets heavily reliant on one or two large e-commerce or retail anchors can see outsized vacancy swings if that tenant restructures its network, something that happened in several markets when large retailers closed distribution nodes after over-expanding.
A Practical Checklist for Evaluating Industrial Demand in a Market
Whether the goal is underwriting a specific building, evaluating a REIT’s portfolio exposure, or simply deciding whether a metro area is a good long-term bet, working through the same checklist every time keeps the analysis grounded in mechanics rather than headlines.
- Pull submarket-level vacancy, not just the metro-wide figure, and separate Class A modern product (36ft+ clear height, built after 2015) from older stock.
- Check the under-construction pipeline as a percentage of existing stock; anything above 3% in a single submarket warrants caution about near-term rent growth.
- Look at net absorption trends over the past four to six quarters, not a single quarter, since one large lease or move-out can distort a single period.
- Identify the top three tenant industries active in that market’s recent leasing (3PL, e-commerce, food and beverage, automotive supply chain) to gauge concentration risk.
- Confirm power availability and utility interconnection timelines for any site being considered for automated or high-density use.
- Compare asking rent growth against effective rent growth; concession packages (free rent, tenant improvement allowances) can hide real softness even when asking rents look stable.
- Review the market’s exposure to trade-policy shifts — proximity to a border crossing, port, or rail intermodal hub cuts both ways depending on tariff direction.
- Cross-check cap rate assumptions against recent comparable sales, not stale data from the 2021–2022 peak pricing cycle.
Key Takeaways
- Industrial real estate demand is driven jointly by e-commerce fulfillment intensity, supply-chain reshoring toward Mexico and the Sun Belt, a sharply reduced construction pipeline, and gradual inventory rebuilding.
- National vacancy rose from roughly 3.5% in 2022 to about 6.8% by early 2025, primarily because deliveries from the 2021–2023 construction boom kept landing even after new groundbreakings collapsed.
- Construction starts fell more than 70% from their 2022 peak, setting up a tighter market once the remaining delivery pipeline clears, likely by late 2026 in most primary metros.
- Modern specifications — 36 to 40 foot clear heights and adequate power capacity for automation — increasingly separate genuinely competitive supply from technically vacant but functionally obsolete older buildings.
- Market-by-market variation is enormous; treating industrial real estate as a single uniform national asset class will lead to mispriced decisions in both directions.
Frequently Asked Questions
What is the single biggest driver of industrial real estate demand today?
E-commerce fulfillment remains the largest structural driver because it requires roughly three times more warehouse space per dollar of sales than traditional retail distribution, but the current cycle is being shaped just as much by the supply side — specifically how far construction starts have fallen since 2022.
Why did industrial vacancy rise even though demand didn’t collapse?
Vacancy rose mainly because buildings that broke ground during the 2021–2022 construction boom kept delivering into 2023 and 2024, adding new supply to the market even after demand growth had normalized from its pandemic-era pace and new construction starts had already collapsed.
How is nearshoring changing which markets see the most demand?
Nearshoring is pulling incremental demand toward Mexican industrial parks around Monterrey and Tijuana and toward U.S. border and gateway markets like Laredo and El Paso, along with Sun Belt manufacturing hubs such as Phoenix and the Carolinas, without eliminating the large existing footprint in traditional coastal gateway markets like the Inland Empire.
Why does clear height matter so much in modern warehouse demand?
Taller clear heights, now standard at 36 to 40 feet in new construction versus 24 to 28 feet in older buildings, let tenants store more inventory vertically on the same land footprint, which is especially valuable in supply-constrained infill markets where land is the scarcest and most expensive input.
When is the industrial market expected to tighten back up?
Most forecasts point to the tail end of the 2021–2023 construction delivery wave clearing by late 2025 to mid-2026, after which the combination of a thin under-construction pipeline and steady absorption is expected to pull most primary markets back toward 5.5% to 6% vacancy.
References
- CBRE Industrial & Logistics research, quarterly market vacancy and rent tracking
- JLL Research, industrial construction pipeline and absorption reports
- Cushman & Wakefield MarketBeat, submarket-level industrial statistics
- U.S. Census Bureau, Quarterly Retail E-Commerce Sales reports
- Federal Reserve Bank data on commercial construction lending conditions
- Prologis Research, logistics real estate demand and supply commentary